Choosing where to live is one of the most consequential decisions most people ever make. You weigh up schools, commute times, local amenities, and of course, price. But one factor that often gets glossed over during property searches — or buried in anecdote and hearsay — is neighbourhood safety. How do you actually verify whether an area is as safe as the estate agent claims?
The good news is that England and Wales have some of the most transparent crime data systems in the world. Every police force publishes monthly crime records, and that data is publicly available. The challenge has always been making sense of it — until now.
Why Crime Data Should Be Part of Every Move Decision
People often rely on gut feeling or word of mouth when assessing an area's safety. A street might look perfectly quiet on a Sunday afternoon viewing, but what's the reality on a Friday night? Crime patterns vary enormously not just between cities, but between adjacent streets in the same postcode district.
Beyond personal safety, crime statistics have a measurable impact on property values and insurance premiums. Areas with sustained high crime rates tend to see slower price growth and higher contents insurance costs. Conversely, understanding which neighbourhoods are genuinely improving — where crime is trending downward — can help buyers and renters identify undervalued areas before the market catches on.
What the Official Data Covers
UK police forces publish crime data monthly through the national data.police.uk API. This includes street-level records for categories such as:
- Anti-social behaviour
- Burglary and theft
- Vehicle crime
- Violence and sexual offences
- Robbery and public order offences
- Drug-related offences
Each record is geocoded to a neighbourhood and includes outcome data — whether a suspect was charged, given a community resolution, or the case remains under investigation.
Introducing CrimeRadar: Free UK Crime Data, Made Readable
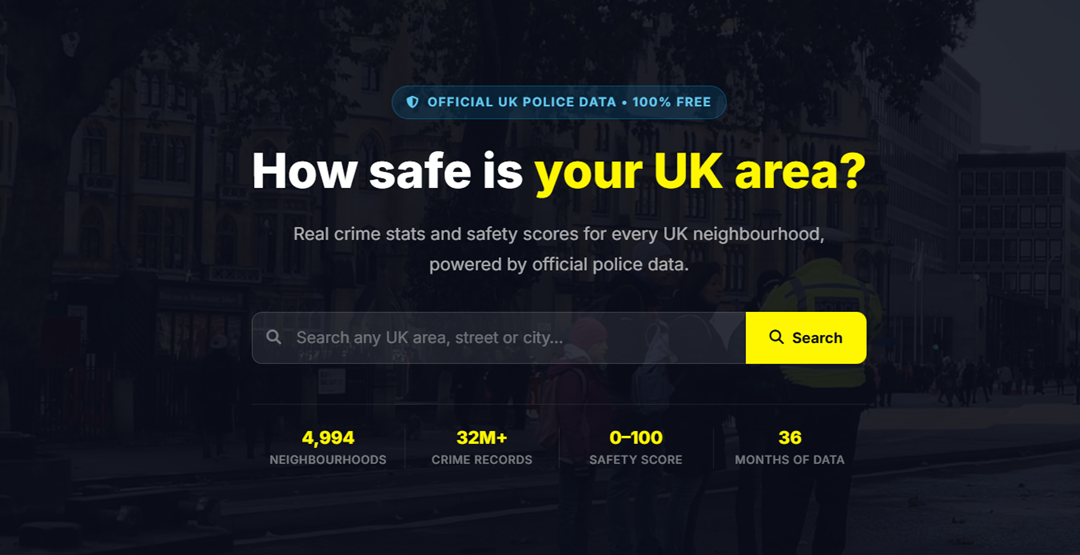
CrimeRadar.co.uk is a free online tool that aggregates 36 months of official UK police crime data and presents it in a clear, neighbourhood-level format. Rather than wading through raw data files or cryptic spreadsheets, you get an interactive crime map, safety scores, trend indicators, and the ability to compare areas side by side.
The platform covers all 44 police forces across England and Wales — from the Metropolitan Police and Greater Manchester to smaller regional forces like Dyfed-Powys and Cumbria. That means whether you are considering moving to London, Manchester, Bristol, Leeds, or a rural market town, the data is there.
Key Features at a Glance
- Interactive crime map — click any neighbourhood zone to see its crime breakdown
- Safety scores — a single 0–100 score calculated from volume, trend, and crime outcomes
- 36 months of data — spot long-term patterns, not just a snapshot
- Safest neighbourhoods rankings — find the lowest-crime areas nationally
- Area comparison tool — put two neighbourhoods side by side
- 44 police forces covered — complete England and Wales coverage
How to Use CrimeRadar: Step by Step
Using the tool is straightforward, even if you have no prior experience with crime data. Here is how to get the most out of it in a few minutes.
Step 1 — Search for Your Area
Head to the crime map and type a postcode, town, or street name into the search bar. The map will zoom to your area and display the neighbourhood zones that the local police force uses for their reporting boundaries. These zones are defined by each force and typically correspond to recognisable local areas — a village, a town ward, or a district within a city.
Step 2 — Click a Neighbourhood Zone
Clicking on any highlighted zone on the map opens a sidebar panel with detailed information for that neighbourhood. You will see the overall safety score, a breakdown of crime categories over the past 36 months, a trend indicator showing whether crime is rising or falling, and the outcome rate — the proportion of crimes that resulted in a charge or conviction.
Step 3 — Explore the Rankings
Not sure where to start? The safest neighbourhoods page ranks areas nationally, allowing you to filter by region or police force. This is particularly useful if you have flexibility about where you move and want data to guide your shortlist rather than estate agent marketing copy.
Step 4 — Compare Two Areas
The compare tool lets you put two neighbourhoods head to head. This is ideal when you are torn between two properties in different areas, or when you want to validate whether the slightly cheaper neighbourhood you are considering has noticeably higher crime levels than your first choice.
Understanding the Safety Scores
CrimeRadar's safety scores are not arbitrary — they are calculated dynamically from three weighted factors: crime volume over 36 months, the direction of the trend (improving or worsening), and the outcome rate. A score of 100 would represent an area with very low crime, a falling trend, and a high proportion of cases resolved. A score near zero reflects the opposite.
The scores are grouped into five bands to make interpretation easy:
Because the scores are dynamic and recalculated each month as new data arrives, they reflect the current reality of an area rather than a historical snapshot. An area that scored poorly two years ago may have improved substantially — and the trend line will show that.
What Crime Data Cannot Tell You
It is worth being honest about the limitations of any crime statistics tool. Recorded crime data reflects offences that were reported to and recorded by the police. Some categories of crime — particularly domestic incidents and certain types of fraud — are known to be under-reported, meaning the numbers understate the true picture. This applies across all areas equally, so comparisons between neighbourhoods are still valid, but it is worth bearing in mind when reading the raw totals.
A Note on Context
Crime rates in dense urban centres will almost always look higher in absolute terms than rural areas, simply because more people and more activity is concentrated in a smaller space. CrimeRadar's scores account for this to a degree, but if you are comparing a city centre neighbourhood to a village, the raw numbers will differ significantly by nature. Use the comparison tool to benchmark like-for-like areas where possible.
Who Is This Useful For?
First-Time Buyers
Before committing to the biggest purchase of your life, verify the safety profile of the street and neighbourhood. A 15-minute check could save years of regret.
Renters
Rental decisions are made faster with less information than property purchases. CrimeRadar gives renters the same data access that savvy buyers have always had.
Families with Children
School catchment areas and anti-social behaviour hotspots do not always align the way you might hope. Check both before assuming an area is family-friendly.
People Relocating for Work
When you are moving to an unfamiliar city, local knowledge is hard to come by. 36 months of objective data is a reliable substitute for years of lived experience.
Property Investors
Identifying neighbourhoods where crime is trending downward — before the wider market notices — is a genuine edge. CrimeRadar's trend data makes that analysis possible.
Journalists and Researchers
The compare and rankings tools provide a quick way to identify patterns and outliers across the country without needing to process raw data files.
The Bottom Line
Crime statistics should be part of every informed property decision in the UK. The data exists, it is public, and now — thanks to tools like CrimeRadar.co.uk — it is accessible to anyone in a few clicks. There is no longer any reason to rely on guesswork, estate agent assurances, or outdated local reputation when making one of the most important decisions of your life.
Whether you are finalising a shortlist of neighbourhoods, trying to understand why two otherwise similar streets have different asking prices, or simply curious about where you already live, the tool gives you a factual, data-driven starting point that no amount of browsing Rightmove will provide.
Start Exploring UK Crime Data
Free to use. No account required. 36 months of official police data across all 44 forces in England and Wales.
Visit CrimeRadar.co.uk Open Crime Map Safest Neighbourhoods